USD/CNH Price Analysis: Clings to 50-day SMA following the latest pullbacks
- USD/CNH nears one-week low after taking a U-turn from 100-day SMA.
- 21-day SMA could please sellers during further downside.
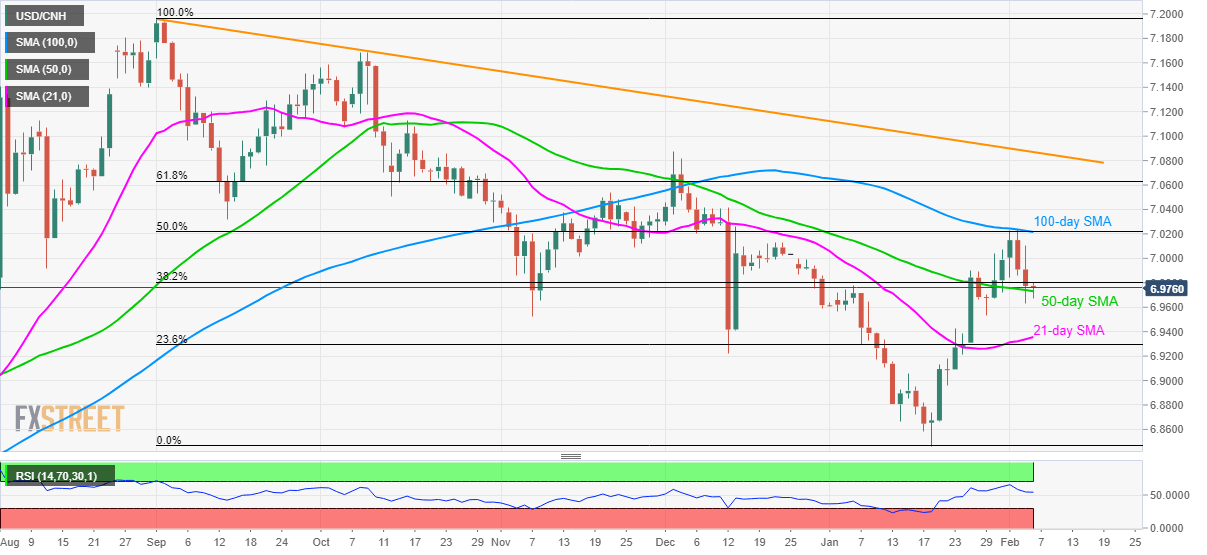
USD/CNH stays modestly changed to 6.9785 as Chinese markets open for Thursday’s trading session. The pair recently reversed from the key resistance confluence including 100-day SMA and 50% Fibonacci retracement of its fall from September 2019 to January 2020. However, 50-day SMA seems to limit the pair’s immediate declines.
As a result, the chances of the pair’s bounce to 7.000 round-figure becomes too high. Though, its further advances seem difficult unless clearing the 7.0215/20 resistance confluence.
If at all coronavirus fears manage to propel the quote beyond 7.0220 on a daily closing basis, 61.8% Fibonacci retracement level of 7.0630 and a descending trend line from September 2019, currently at 7.0870, will be in focus.
On the downside, pair’s daily closing below 50-day SMA level of 6.9730 can drag it further towards 6.9355 comprising 21-day SMA.
During the quote’s additional weakness past-6.9355, mid-January top around 6.9060 and 6.9000 will act as buffers to the yearly bottom near 6.8460/55.
USD/CNH daily chart
Trend: Pullback expected