Gold Technical Analysis: any meaningful rebound likely to get sold into
• Struggles to register any meaningful recovery despite reviving safe-haven demand, amid concerns over a full-blown global trade war, and slightly oversold conditions.
• An occurrence of death cross on the daily chart, 50-day SMA crossing the very important 200-day SMA from the top, adds credence to last week's bearish break below a medium-term ascending trend-line, extending from Jan. 2017 lows through lows touched in July/Dec. 2017.
• Acceptance below 38.2% Fibonacci retracement level of the Dec. 2016-Jan. 2018 up-move ($1123-$1366) further reinforces the bearish the negative outlook and hence, any recovery attempts are likely to get sold into.
Gold daily chart
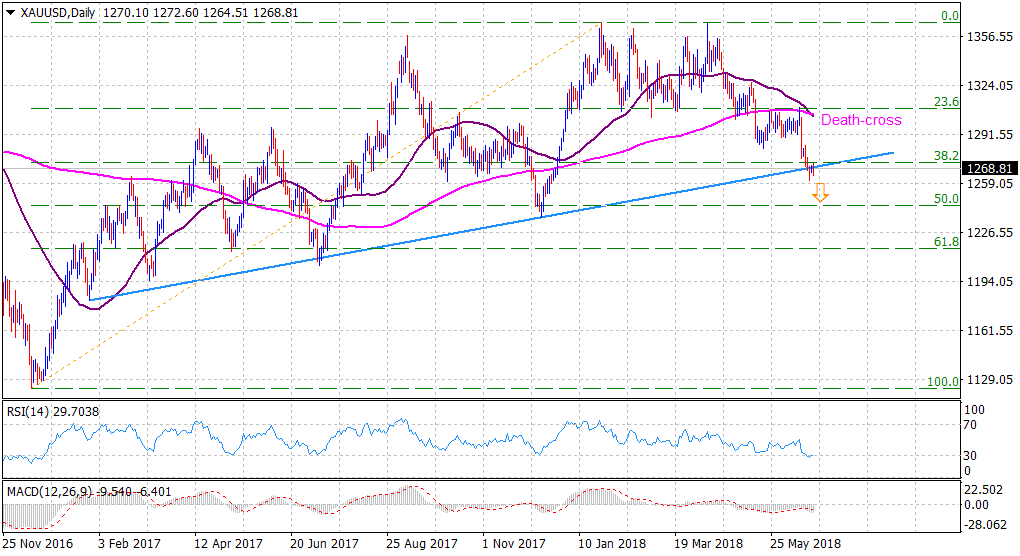
Current Price: $1269
Daily High: $1272
Daily Low: $1264
Trend: Bearish
Resistance
R1: $1273 (38.2% Fibo. level)
R2: $1278 (horizontal level)
R3: $1284 (last week's swing high)
Support
S1: $1261 (YTD low set on June 21)
S2: $1253 (Horizontal level)
S3: $1244 (50% Fibo. level)