GBP/USD Price Analysis: Stays bullish, climbs to four-day high
- GBP/USD climbs to 1.2772, close to a four-day high of 1.2784.
- Technical outlook shows upward bias with RSI pointing higher but not yet overbought.
- Key resistance at 1.2800; surpassing it could lead to YTD high of 1.2893, while support lies at 1.2643 and 1.2600.
The British Pound rallied for the third straight day against the US Dollar, gaining some 0.37% in early trading during the North American session. The GBP/USD exchanged hands at 1.2785, shy of a four-day high of 1.2787 reached during the European session.
GBP/USD Price Analysis: Technical outlook
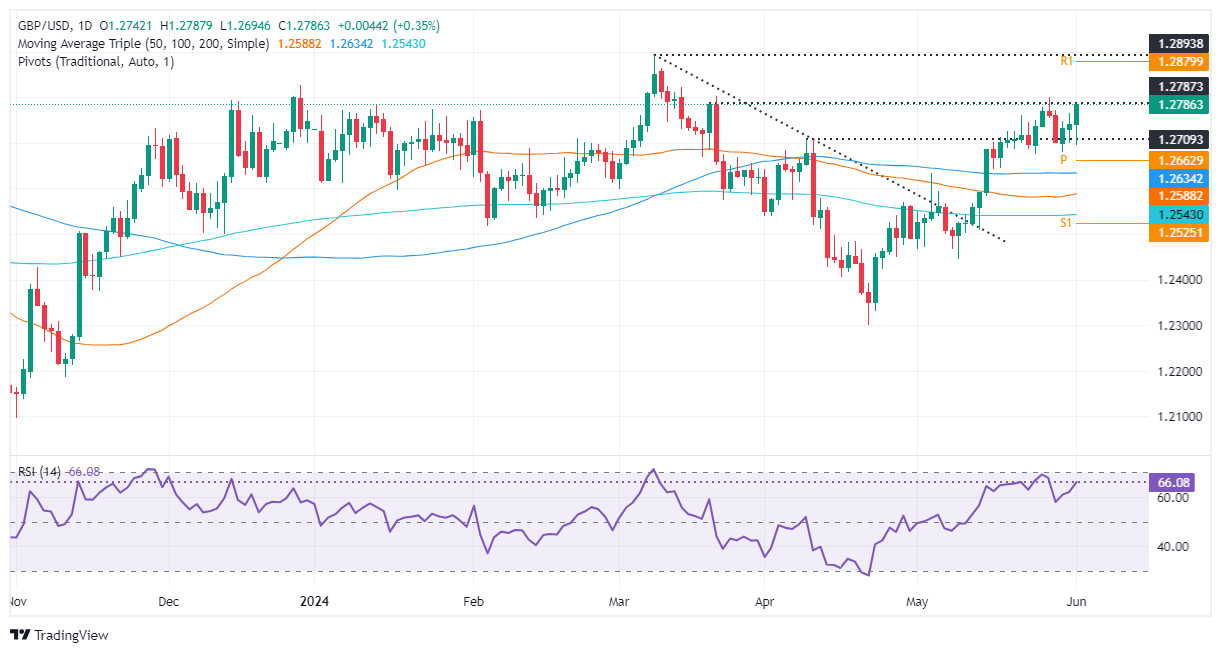
From a daily chart perspective, the GBP/USD is upward biased as buyers gain momentum, reflected on the Relative Strength Index (RSI). The RSI aims upwards yet with a room before turning overbought.
That said, buyers need to clear the conglomeration of technical levels, with the 1.2800 figure and a downslope resistance trendline passing around that area. Once surpassed, the next stop would be the year-to-date (YTD) high of 1.2893, which is shy of 1.2900.
On the other hand, if GBP/USD tumbles below 1.2700, that could sponsor a leg down toward the confluence of the May 3 high turned support and the 100-day moving average (DMA) at around 1.2643. Further losses lie at 1.2600.
GBP/USD Price Action - Daily Chart