确认您不是来自美国或菲律宾

在此声明,本人明确声明并确认:
  • 我不是美国公民或居民
  • 我不是菲律宾居民
  • 本人没有直接或间接拥有美国居民10%以上的股份/投票权/权益,和/或没有通过其他方式控制美国公民或居民。
  • 本人没有直接或间接的美国公民或居民10%以上的股份/投票权/权益的所有权,和/或受美国公民或居民其他任何方式行使的控制。
  • 根据FATCA 1504(a)对附属关系的定义,本人与美国公民或居民没有任何附属关系。
  • 我知道做出虚假声明所需付的责任。
就本声明而言,所有美国附属国家和地区均等同于美国的主要领土。本人承诺保护Octa Markets Incorporated及其董事和高级职员免受因违反本声明而产生或与之相关的任何索赔。
我们致力于保护您的隐私和您个人信息的安全。我们只收集电子邮件,以提供有关我们产品和服务的特别优惠和重要信息。通过提交您的电子邮件地址,您同意接收我们的此类信件。如果您想取消订阅或有任何问题或疑虑,请联系我们的客户支持。
Octa trading broker
开通交易账户
Back

NZD/USD Price Analysis: Bulls take a breather, bears must conquer the 0.6100 mark to start talking

  • The NZD/USD is taking a breather after last week’s rally.
  • The pair are building a fortification around the 0.6100 area following multiple bullish crossovers of the 20-day SMA.
  • Multiple bullish SMA crossovers confirm the positive outlook.

On Thursday, the NZD/USD pair traded neutrally around the 0.6115 level as bullish momentum paused. The outlook turned positive after the pair surged above the 100 and 200-day Simple Moving Averages (SMA) last week, with the 20-day SMA forming a bullish crossover, solidifying support at 0.6100.

In the daily analysis, the Relative Strength Index (RSI) shows a neutral trend with the recent RSI readings at 60, indicating that buying pressure has steadied. The slope has flattened compared to previous sessions, suggesting stability in bullish momentum. This neutral tendency in the RSI coincides with flat green bars on the Moving Average Convergence Divergence (MACD), hinting at a continued yet steady upward trend.

NZD/USD daily chart
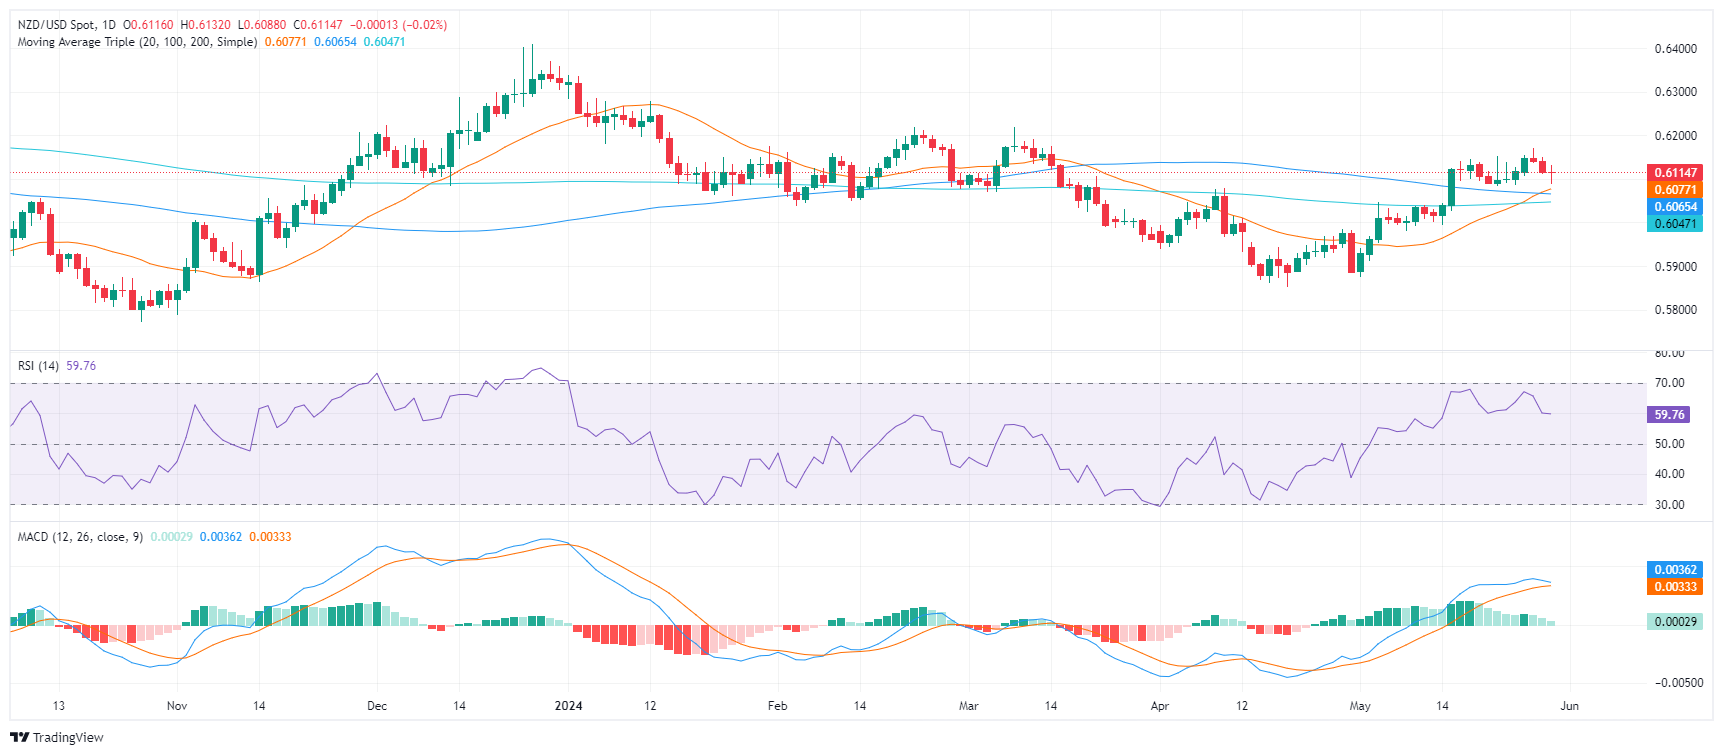
Further support comes from the NZD/USD pair maintaining its position above last week's 100 and 200-day SMA. This was fortified by the 20-day SMA completing a bullish crossover with the 100 and 200-day averages, building robust support around the 0.6100 mark. Any movements that keep the pair above these levels won’t threaten the overall bullish trend.


NZD/USD

Overview
Today last price 0.6115
Today Daily Change -0.0001
Today Daily Change % -0.02
Today daily open 0.6116
 
Trends
Daily SMA20 0.6069
Daily SMA50 0.6007
Daily SMA100 0.6067
Daily SMA200 0.6046
 
Levels
Previous Daily High 0.6151
Previous Daily Low 0.6111
Previous Weekly High 0.6153
Previous Weekly Low 0.6083
Previous Monthly High 0.6079
Previous Monthly Low 0.5851
Daily Fibonacci 38.2% 0.6126
Daily Fibonacci 61.8% 0.6136
Daily Pivot Point S1 0.6101
Daily Pivot Point S2 0.6086
Daily Pivot Point S3 0.6061
Daily Pivot Point R1 0.6141
Daily Pivot Point R2 0.6166
Daily Pivot Point R3 0.6181


Crude Oil falls back despite supply declines ahead of anticipated OPEC+ meeting

West Texas Intermediate (WTI) US Crude Oil backslid on Thursday, with energy markets shrugging off a sharp downturn in reported US Crude Oil stocks.
了解更多 Previous

EUR/USD hamstrung in the midrange ahead of Friday full of key data

EUR/USD dipped to 1.0790 on Thursday before a broad-market recovery forced the Greenback lower across the board.
了解更多 Next