Gold Price Forecast: XAU/USD bulls testing the H&S' neckline
- Gold is on the verge of a breakout of the inverse H&S
- Bulls need to close above a key resistance area on the daily chart of $1,668.
The price of gold is trying to get above a key resistance area on the daily chart of $1,668 where it needs to close on a daily basis to instil confidence in the bulls that there is fuel in the tank for a potentially significant continuation of this current correction. $1,675 the high was achieved on Wednesday as the US dollar continued to slide, but the close of $1,665 was less than convincing.
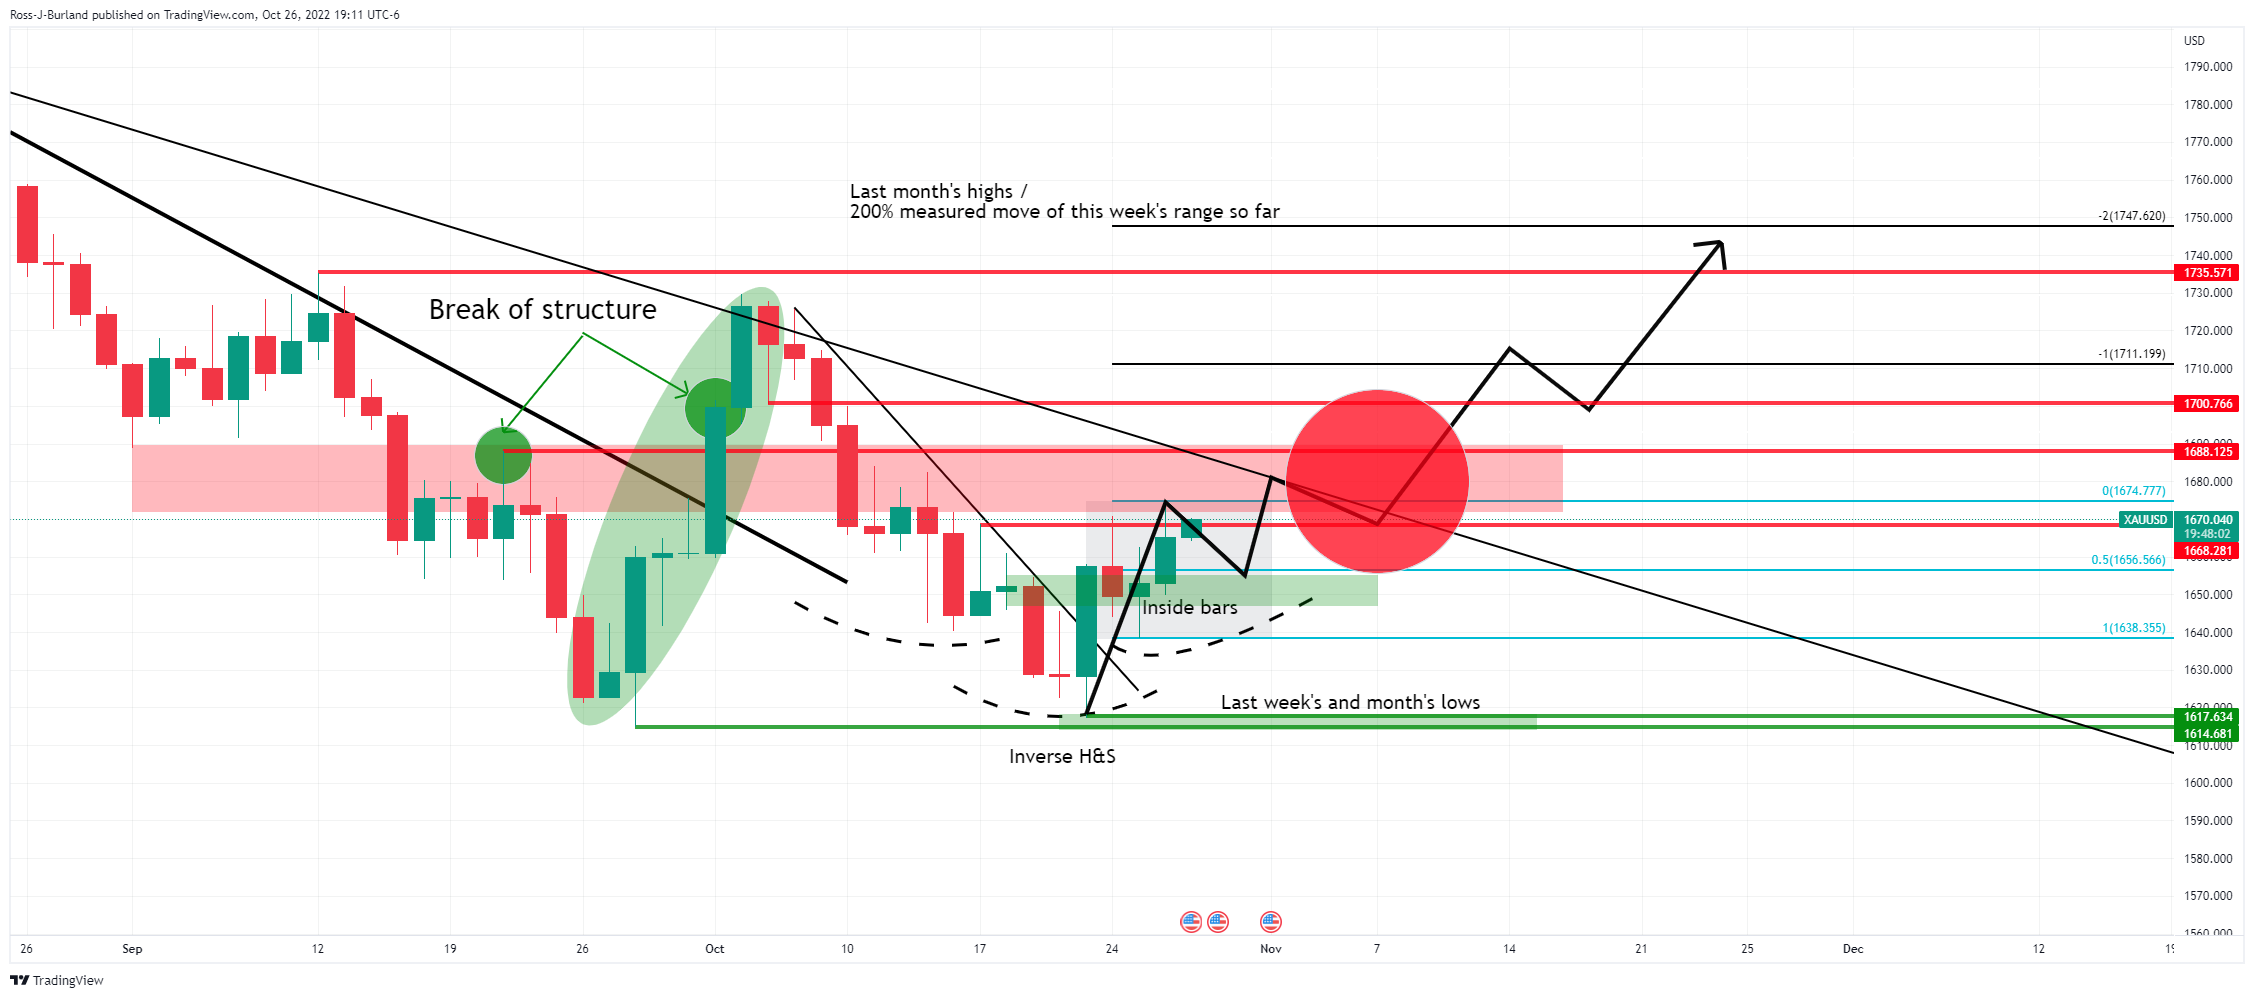
With that being said, the daily chart, above, shows a number of bullish confluences following the break of the daily structure back on Oct 3 to take the gold price on the back side of the daily trendline resistance.
The price moved back into Wednesday 22 Sep bullish peak formation lows in a micro daily bear trend. We have broken on the backside of the micro (secondary) daily trendline on Fri 22 Oct and we now have two prior inside days that are being broken mid-week, Wednesday, potentially setting the yellow metal up for a close above the aforementioned key resistance of $1,668.
In doing so, this will likely be the foundation of a breakout of the inverse head and shoulders neckline for a 150% measured move of this week's range so far to target last month's highs of near $1,735. A close above the $1,670 neckline could be the trigger point to start looking for the set-up on lower time frames.